Global Navigation

Main Navigation
Content
PROGRESSIVE ENERGY INDEX® (WHPRO)
WilderHill Progressive Energy Index® (WHPRO) calculated Live from 2006 through early 2019. It was a modified equal-weight index that could as a near-term energy bridge for fossil fuels reduce their carbon dioxide (CO2) and Greenhouse Gasses (GHGs), conventional and other pollution, progressively improving efficiency. Sectors included alternative fuels, emissions reduction, energy efficiency, innovation in energy materials, production and use. A focus was on transitional bridge technologies that could address climate change, reduce the many harms from inherently dirty coal, oil, and natural gas, enhance efficiency, or make better use of these persistent still-major, non-renewable energy sources.
Besides capturing options that can help reduce pollution or make better use of coal, oil, natural gas, & nuclear that dominate our energy portrait - this also captures opportunities to mitigate greenhouse gases because of potential climate risk.
Both attentive to energy security & energy independence, as well as to climate risk, we may include near-term options that can carry some downsides yet mitigate CO2: we are inclusive for mainly carbon-neutral options, like biofuels. Diverse companies with exposure to nuclear may be included, but past generation nuclear is not a priority; next-generation or advanced nuclear power may be considered if safer and better. Zero-carbon, pure play companies such as in renewable solar & wind power that prevent pollution in the first place are mainly excluded from this Index. General Rules as guidelines for WHPRO Index are here.
Eligibility Criteria for Index Components
Generally the Index requires that:
- The WilderHill Progressive Energy Index uses a modified equal dollar weighting methodology. No single stock may exceed 5% of the total Progressive Energy Index weight at the quarterly rebalancing.
- For a stock to be included in the selection universe, a company should be identified as having significant exposure to transitional energy technologies that improve near-term use of fossil fuels, oil, coal and natural gas, next-generation nuclear power, companies that advance pollution control or efficiency, including that address climate change risk, or are important in developing domestic non-renewable energy. Companies exposed to lower-carbon options such as natural gas, carbon-neutral renewable ethanol or biofuels and other less-polluting alternative fuels, as well as better energy efficiency in particular are included, as are companies exposed to advances in materials and energy use.
- To be eligible for the Progressive Energy Index, a stock must generally have: (i) a three-month average market capitalization of at least $150 million; (ii) a three-month average closing price above $1.00 if not currently in Progressive Energy Index; and (iii) a listing on NYSE, NYSE American, or NASDAQ, and if a foreign entity, have its ADRs listed on NYSE, NYSE American, or NASDAQ.
- Components less than $400 million in total market capitalization are banded and so set to a one-half of one percent (0.5%) weight.
Calculation Methodology
The Index is calculated using a modified equal dollar weighting methodology. Component securities and weights are determined by their respective Sector and size. Each Sector is assigned an aggregate weighting within the index. Components less than $400 million in total market capitalization are banded and set to one-half of a percent (0.5%). The remaining components in each Sector are equally weighted by using the Sector weightings minus the sum of the weights of less than $400 million in market capitalization. Sector weightings were initially determined by the Index Provider and are reviewed each quarter in conjunction with the scheduled quarterly review of the Index. Generally within each sector, components weighting cannot exceed five percent (5%) of index at rebalance.
Viewpoint from the WHPRO Index Launch in 2006: A Comparison of Progressive Energy Index® (WHPRO) with the WilderHill Clean Energy Index® (ECO): A Non-Overlapping of Stocks
Notably this WH Progressive Energy Index® is significantly different from the WilderHill Clean Energy Index® (ECO) launched August 16, 2004 and more on that is at www.wildershares.com. Unlike that original ECO Index designed for the clean energy sector and so specifically for non-fossil fuel sources like zero-carbon solar or wind power the latest WH Progressive Energy Index® (WHPRO) is designed to instead track transitional bridge technologies for reducing harms stemming from dominant energy of today: inherently dirty fossil fuels, coal, oil and natural gas.
Importantly there is no concurrent overlap between the stocks themselves that make up the two Indexes; generally none of the stocks in ECO in any one Quarter are also in WHPRO at the same time and visa-versa. At times we expect a company may migrate from one Index into the other, should their activity grow for instance in developing renewable zero-carbon energy to prevent pollution (green power, for ECO) or they move to reducing a pollutant from fossil fuels (going to WHPRO) however they will generally be moved from one Index and into the other, and thus not appear in both in the same Quarter. We post below Correlation data showing a significant non-correlation between WHPRO & ECO.
More broadly for a company to be considered for inclusion in WH Progressive Energy Index® in the first place, their share price movement should be impacted in a meaningful way by work they may do in a relevant energy endeavor. While this WH Progressive Energy Index® (WHPRO) is expected to have significant composition of larger cap stocks, the more pure-play WH Clean Energy Index (ECO) instead focuses on smaller volatile renewable energy companies that are often $1-10 billion in size or less. WHPRO is expected to have many large and wide-ranging conglomerates working in diverse fields for which progress in New Energy Activity, or in Better Efficiency is just a part of their work. Blue chip famous company names in WHPRO are often recognizable; those in ECO are frequently unknown.
The Index Rules also should lead to sizably less volatility for WHPRO, compared to ECO. The minimum allowable floor for stocks included in the Progressive Energy Index® (WHPRO) is $150 million market cap at the rebalance. Any stocks $150 million-$400 million in size are down-weighted to 0.5% at the rebalance to account for their smaller size. By contrast ECO has a lower minimum floor of $50 million, and any stock between the band of $50 million-$200 million market cap is weighted 0.5% at the rebalance.
In sum we purposefully dont use words like clean or solutions with respect to WHPRO; as noted those more accurately refer to the story of the Clean Energy Index® (ECO). We also as individuals do not seek to be pied-pipers for the compromise technologies of WHPRO, since these are transition technologies to incrementally improve still-dirty fuels. And yet they are importantly near-term approaches that valuably help reduce harm, advance energy efficiency, and make better use of dominant energy sources of today and therefore can be of real utility. Wed emphasize that themes here are often vexing compromises and as such often only lower certain pollutants (not eliminating all harm). Yet these are the near-term advances that would likely be tied to any progressive improvement in, and decarbonizing of the main energy sources of the early 21st century.
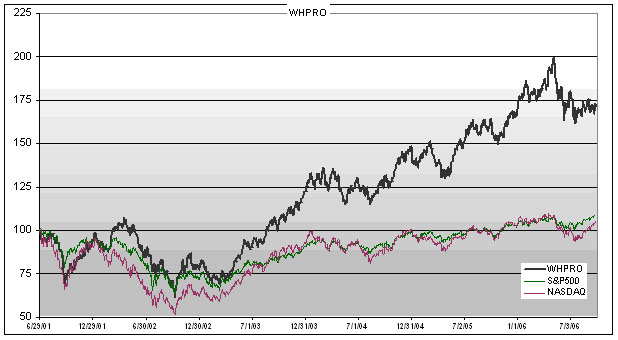
Performance of WHPRO: Backtesting History since 2001.
Correlation data for WHNEF:
| Correlations of Daily Price Returns | ||||
| Start Date | End Date | Period | S&P 500 | NASDAQ Comp. |
| 6/29/01 | 9/29/06 | ITD | 83.37% | 87.06% |
| 9/28/01 | 9/29/06 | 5 YR | 86.37% | 87.05% |
| 9/29/03 | 9/29/06 | 3 YR | 83.31% | 86.37% |
| 9/29/05 | 9/29/06 | 1YR | 84.84% | 86.99% |
| Correlations of Daily Price Returns, WHPRO vs. ECO etc | |||||
| Start Date | End Date | Period | S&P 500 | NASDAQ Comp. | ECO |
| 6/29/01 | 9/29/06 | ITD | 83.37% | 87.06% | 79.23% |
| 9/28/01 | 9/29/06 | 5 YR | 83.09% | 87.05% | 78.98% |
| 9/29/03 | 9/29/06 | 3 YR | 83.31% | 86.37% | 75.96% |
| 9/29/05 | 9/29/06 | 1YR | 84.84% | 86.99% | 79.69% |
Historical Rebalances
Q1 2019 WHPRO Index Stocks & Sectors
Q4 2018 WHPRO Index Stocks & Sectors
Q3 2018 WHPRO Index Stocks & Sectors
Q2 2018 WHPRO Index Stocks & Sectors
Q1 2018 WHPRO Index Stocks & Sectors
Q4 2017 WHPRO Index Stocks & Sectors
Q3 2017 WHPRO Index Stocks & Sectors
Q2 2017 WHPRO Index Stocks & Sectors
Q1 2017 WHPRO Index Stocks & Sectors
Q4 2016 WHPRO Index Stocks & Sectors
Q3 2016 WHPRO Index Stocks & Sectors
Q2 2016 WHPRO Index Stocks & Sectors
Q1 2016 WHPRO Index Stocks & Sectors
Q4 2015 WHPRO Index Stocks & Sectors
Q3 2015 WHPRO Index Stocks & Sectors
Q2 2015 WHPRO Index Stocks & Sectors
Q1 2015 WHPRO Index Stocks & Sectors
Q4 2014 WHPRO Index Stocks & Sectors
Q3 2014 WHPRO Index Stocks & Sectors
Q2 2014 WHPRO Index Stocks & Sectors
Q1 2014 WHPRO Index Stocks & Sectors
Q4 2013 WHPRO Index Stocks & Sectors
Q3 2013 WHPRO Index Stocks & Sectors
Q2 2013 WHPRO Index Stocks & Sectors
Rebalance item - March 2013
Q1 2013 WHPRO Index Stocks & Sectors
Q4 2012 WHPRO Index Stocks & Sectors
Q3 2012 WHPRO Index Stocks & Sectors
Q2 2012 WHPRO Index Stocks & Sectors
Q1 2012 WHPRO Index Stocks & Sectors
Q4 2011 WHPRO Index Stocks & Sectors
Q3 2011 WHPRO Index Stocks & Sectors
Q2 2011 WHPRO Index Stocks & Sectors
Q1 2011 WHPRO Index Stocks & Sectors
Q4 2010 WHPRO Index Stocks & Sectors
Q3 2010 WHPRO Index Stocks & Sectors
Q2 2010 WHPRO Index Stocks & Sectors
Q1 2010 WHPRO Index Stocks & Sectors
Q4 2009 WHPRO Index Stocks & Sectors
Q3 2009 WHPRO Index Stocks & Sectors
Q2 2009 WHPRO Index Stocks & Sectors
Q1 2009 WHPRO Index Stocks & Sectors
Q4 2008 WHPRO Index Stocks & Sectors
Q3 2008 WHPRO Index Stocks & Sectors
Q2 2008 WHPRO Index Stocks & Sectors
Q1 2008 WHPRO Index Stocks & Sectors
Q4 2007 WHPRO Index Stocks & Sectors
Q3 2007 WHPRO Index Stocks & Sectors
Q2 2007 WHPRO Index Stocks & Sectors
Q1 2007 WHPRO Index Stocks & Sectors
Q4 2006 WHPRO Inception, Stock Symbols & Sectors